Monitoring Caddy with Grafana
What will we be doing?
We will be setting up Grafana to Analyse Caddy logs and provide us with some informative graphs.
This is just covering a basic installation and should take no longer than 5 Minutes!
There is lots of room to extend beyond this and create some sexy graphs from your Caddy Metrics.
Setup
- Setup a Self-Hosted Grafana Instance or use Grafana Cloud there is a generous free tier.
- Select the Caddy Integration (Under the Lightning Bold Menu)
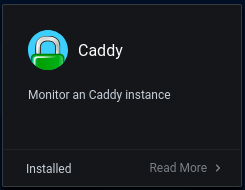
- Follow the on-screen install instructions.
You may need to install unzip:sudo apt install unzip
- Test that Caddy Metrics is enabled
curl http://localhost:2019/metrics
You should see a log file outputted. If not, enable it!
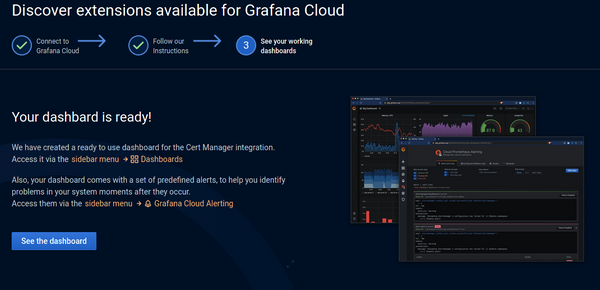
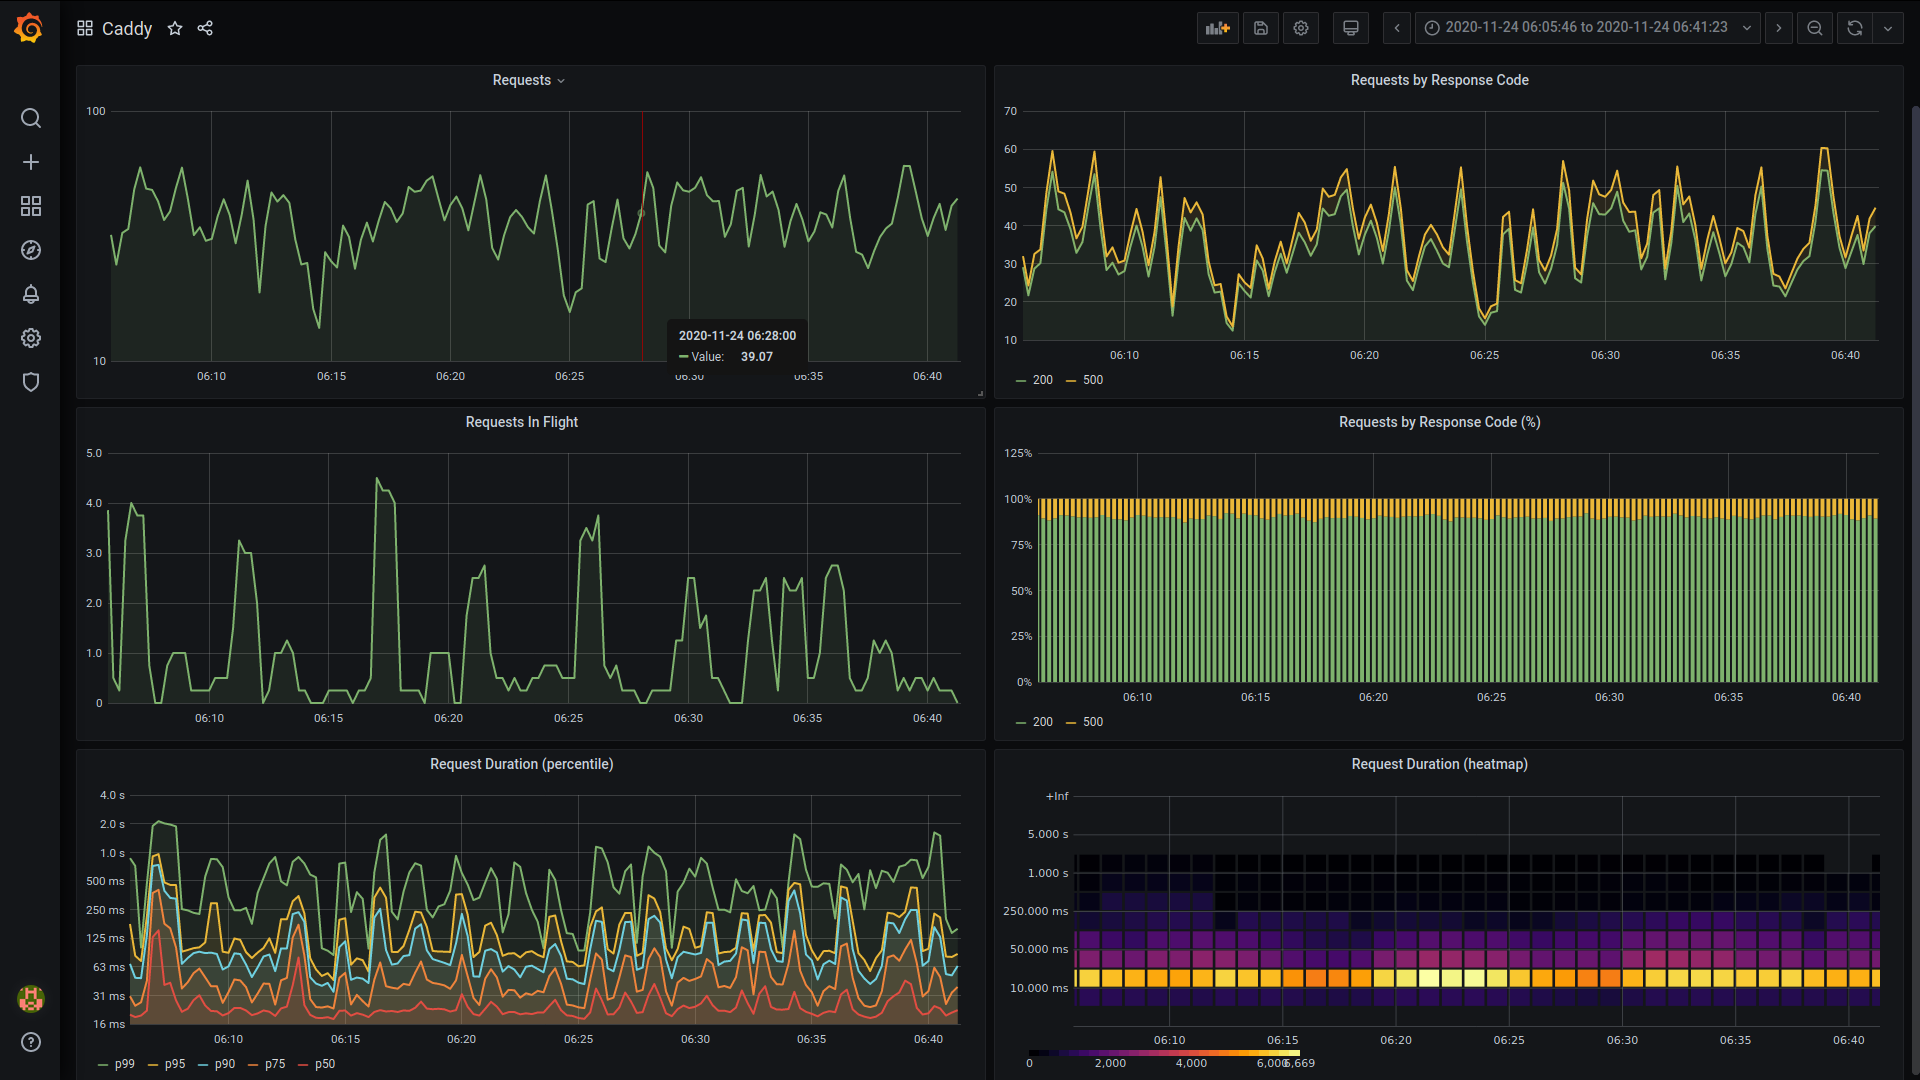
It's as simple as that and Grafana has even generated a Dashboard for us!
Take a look at Caddy Metric Docs and then create your own panels!
Email any screenshots/queries of your sexy panels and I'll add them in below, for the benefit of others 🙂
Cover Image Credit: https://www.pexels.com/@thisisengineering